NFIB
Almost Half of Small Business Owners Surveyed Anticipate Needing Additional Financial Support Over the Next Six Months

The majority (71%) of owners have used their entire PPP loan
The NFIB Research Center recently released a survey on the state of small business and the Paycheck Protection Program (PPP). The PPP loan application closed on August 8, after Congress extended the deadline to allow more small business owners to participate. Most small business owners (71%) have used their entire PPP loan. However, 46% of borrowers say they anticipate needing additional financial support in the coming months.
“Current economic conditions are putting significant stress on small business owners struggling to balance lower sales, expenses, and longer-term sustainability,” said Holly Wade, NFIB Director of Research & Policy Analysis. “Even for those owners who have exhausted their PPP loan, the economic conditions have not yet returned to levels that can support business activity for many.”
Key findings from the survey include:
The majority (71%) of small business owners have now used their entire PPP loan.
- The 29% still using their loan are likely not far behind.
Borrowers are now waiting for lenders to start accepting loan forgiveness applications.
- The SBA has recently issued processing instructions and just over one-third of small business borrowers plan to use the EZ form. Another 61% are not sure if they will use the EZ form or the long form.
Some small business owners (21%) have or anticipate having to lay off employees after using the PPP loan.
- This is generally unchanged from NFIB’s July 7th survey at 22%.
Almost half (46%) of PPP loan borrowers also anticipate needing additional financial support over the next 12 months.
- Congress is currently negotiating additional support. NFIB issued a Phase Four Legislative Priorities for Small Business Recovery, which includes near- and longer-term financial assistance for small businesses.
Almost half of small business owners (46%) are nearly back to where they were with some exceeding pre-COVID sales levels.
- Thirty-two percent report sales levels of 50-74% from last year.
- Twenty-one percent of small businesses still in operation have sales levels that are less than half of what they were this time last year.
About 23% of small business owners report that they will have to close their doors if the current economic conditions do not improve over the next six months.
- Another 22% of owners anticipate they will be able to operate no longer than 7-12 months under current economic conditions.
- Over half (56%) are better situated and do not anticipate any near-term problems.
More small business owners find it difficult to pay their mortgage/rent/lease payments than any other expense category.
- About 54% of owners rent their business property while another 40% own.
- Seven percent both rent and own property used for business purposes.
- About one-third of respondents own investment property and 77% of them collect rent from those properties.
- Just over one-third (34%) of those who have renters are experiencing more difficulty collecting rent than normal.
Over one-third (35%) of small business owners are “very” or “moderately” concerned about contracting COVID-19 themselves while operating their business.
- Another 35% are somewhat concerned.
- Most small business owners (86%) are 100% involved in the daily operations of their business, with another 10% of owners more than 75% involved in daily operations.
Most small business owners expect business conditions to improve to normal levels by the end of 2021.
- Seventeen percent of owners anticipate conditions improving to normal levels by the end of the year with 2% saying conditions are back to normal now.
- Over half (52%) of owners anticipate it taking until sometime in 2021 and 25% are less optimistic and expect conditions not to fully improve until sometime between 2022-2024.
The full survey is available here.
How to Use Google Analytics with Your Small Business Website

You have a website for a reason. You want it to improve your small business by generating leads, increasing brand awareness, or to sell your services online. But how do you know if your website is doing its job? And, more importantly, how do you optimize its performance?
A website is the first step towards building a digital presence to strengthen your small business, but websites are never perfect from the start. They require constant monitoring, adjusting, and strategizing to make sure they’re constantly being improved. This is where digital analytics tools like Google Analytics come in. They help your small business understand exactly what is and isn’t working, and which marketing channels are driving the most qualified traffic.
Read on for an overview of how to set up and monitor Google Analytics for your small business website and get tips on how to read reports and improve your site’s overall performance.
What is Google Analytics?
Google Analytics is a free tool that tracks and gathers data from the people who visit your website. It answers three very important questions that can help you strategically improve your website and small business:
1. Who are the people visiting your website?
2. How did they get to your website?
3. What did they do (or not do) on your website?
How does Google Analytics Work?
Google Analytics uses a JavaScript code that collects and processes data that is then presented to you in the Google Analytics platform. A tracking code will collect anonymous information on how users interact with your small business website. It will tell you how many users visited a page, how long they were there, which pages they visited, and where they went next on your website.
The tracking code will also collect browser information like language, browser type (Chrome, Safari, Internet Explorer, etc.), device (desktop, mobile, or tablet), and traffic source (where/what the user clicked to access your website).
Reporting Using Google Analytics
Now that you have a better idea of what the tool is and how it works, let’s go over how the data is organized, and how you can answer key questions about your website. Google Analytics breaks the data into five reporting categories.
1. Real-Time: What’s happening on the website right now?
This category shows how many people are on your website right now, where they came from, and what content (which page) they’re looking at.
There are two scenarios where this report can be useful. First, it shows you live website data, so you can use it to test and make sure analytics is working properly on a page. This is especially helpful when you have set up custom events (like clicks on a marketing email or a link shared on social media). Second, the report can track and possibly optimize the performance of short campaigns.
2. Audience: Who are the people that visit your website?
Audience reports give you information on the people who have visited your website. This includes demographic information about their age, gender, location, and language. Depending on your small business, you might want to look into different reports, but a common category every small business should monitor is the Mobile report.
The Mobile report will show you what percentage of your website visitors come from a mobile device, desktop, or tablet. Mobile device usage continues to grow, and for many websites, it’s the device used the most to access them. This is crucial to monitor because people navigating the internet on a mobile device have different behaviors and objectives. They tend to be on the go and looking for information as easily and quickly as possible. If a big portion of your website traffic is coming from mobile devices, you should be thinking about ways to optimize your site specifically for those users.
3. Acquisition: How did people get to your website?
Google Analytics automatically groups the channels people used to get to your website into some generic categories. For example, if they used Google or Bing search to find a website, they’ll be grouped into the Organic Search channel. If they arrived through a Facebook post, they’ll be grouped into the Social channel. To find this report, click on Acquisition Category > All Traffic > Channels.
This report helps you understand what’s driving people to your website, and the health of each channel. The number of people a channel drives to your website is not necessarily as important as the quality of people it drives. Not every channel will be good at the same thing. While one can be good at increasing brand awareness, the other may be better closing deals or generating leads. It’s important to know and understand what your strategy and objectives for each channel are.
4. Behavior: What did people do on the website?
Within the behavior category, you’ll see Site Content, where you can see the most popular content (pages) on your small business’ website. Two reports that are helpful to understand what content people are most interested in are the Landing Page report and the All Pages Report.
Landing pages are the ones where people arrive at your website. You’ll likely see your home page (/) as the page that receives the most traffic, but below that, you’ll see others that give you an idea of what content is attracting people to the website.
This helps you see the popularity of the content. You can identify which pages are good at keeping people on the website—and driving them to additional pages—and which ones are not. This gives you the opportunity to improve popular landing pages that are not driving people further into the website.
The All Pages report will show you which pages get seen the most by people who visit your website. If you don’t see some of your most important pages in this report, it’s a cue to look for ways to improve the user experience (UX) and make the pages more prominent or relevant.
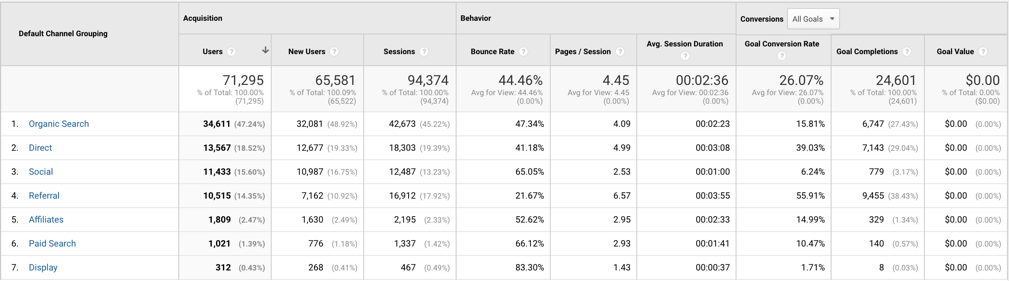
5. Conversions: Which goals did people complete on your website?
This report depends on the way you’ve set up your Google Analytics account. Goals (like requests for information, form completions, calls, or emails to your business, for example) and e-commerce (sales) require a more advanced setup. You’ll need to tell Google Analytics what you consider to be the specific action you want to be completed (goal) on your website.
Setting up goals is crucial, as it will make it easier for you to see exactly what type of people, marketing channels, and online behaviors lead people to convert those specific goals you’ve set up.
Related: Why Potential Customers Leave Your Website
Quick Tips: How to Read Reports
The first thing to consider is the date range. Make sure your date range is set to the period you’re trying to analyze. You’ll find the date range in the top right corner of every report.
On the left-hand corner, you’ll see the segments, which is automatically set up to show you all data but can be adjusted to include only the specific data you want. For example, if you want to look only at people who come from a specific city, you could build a new segment that only shows data from users in that location.
Below the date and segments, you’ll see a timeline (based on your date range) with a blue line that shows how many Users (report dependent) visited your website per day, week, or month. This can be useful when looking over a longer period of time to understand traffic and seasonal trends.
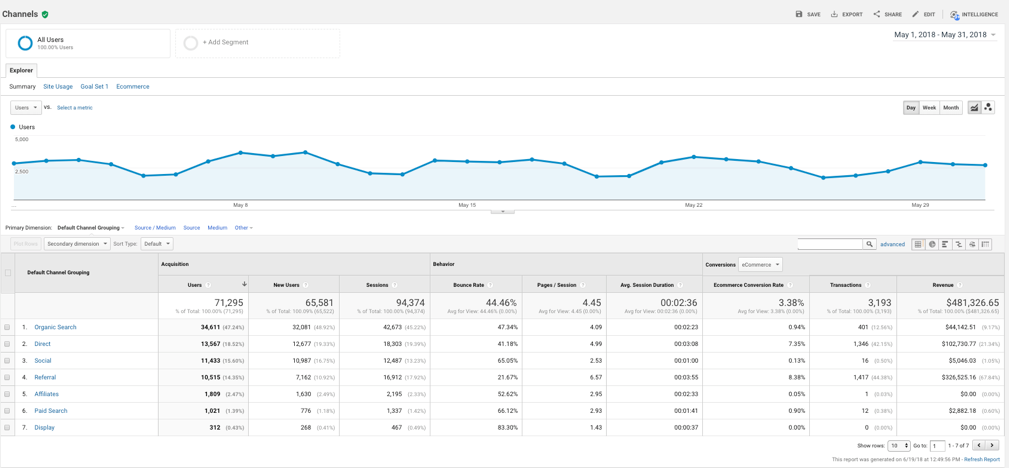
Finally, you’ll see a table with a breakdown of data. Let’s walk through these types of tables.
All tables are broken down into a main dimension. This dimension is the first column of the data table. In the example below, the dimension is Default Channel Grouping, which we talked about above in the Acquisition report.
Each column after that will give you metrics that are relevant to this dimension. Next to each metric, there is a “?” that when hovered over will give you a definition of the metrics. The top row will have a summary of the aggregate data.
Acquisition Metrics:
Users: Unique Individuals that visited the website.
New Users: New people to the website.
Session: Number of times the website has been visited.
Behavior:
Bounce Rate: Percentage of single-page sessions in which there were no interactions with the page.
Pages/Session: The average number of pages people visit during a session.
Avg. Session Duration: The average amount of time people spent on the website during their session.
Conversions:
Drop Down: You can use the drop-down to toggle between e-commerce and the goals you’ve set up on your website.
Ecommerce/Goal Conversion Rate: Percentage of sessions that resulted in a conversion (goal completion).
Transactions/Goal Completions: Total number of transactions or goal completions.
Revenue/Goal Value: Total revenue generated or total goal value (depending on what value in dollar amounts you assign to your goals).
Determine What Matters Most for Your Business
You could spend many hours digging into data about your small business’ website, but that shouldn’t be the case.
Start by determining exactly what you’re trying to accomplish with your website and each of its main pages and work back from these objectives to establish goals you can track. Once you know exactly what you’re looking for, you can figure out a few key metrics and reports that will provide the answers you need to improve your site, your site’s visitors’ experiences, and your small business.
Majority of Small Businesses Nearing the End of the PPP Eight-Week Forgiveness Period

Washington, D.C. (June 2, 2020) – The NFIB Research Center released a survey updating the utilization and financial assistance of both small business lending programs, the Paycheck Protection Program (PPP), and the Economic Injury Disaster Loan (EIDL) Program. The survey also explores the familiarity of the Main Street Lending Program and the prevalence of COVID-19 as related to employee leave.
“The majority of small businesses are still negatively impacted by the economic crisis,” said Holly Wade, NFIB Director of Research & Policy Analysis. “Adding flexibility to the PPP loan forgiveness is one thing our elected officials can do to ease the burden on small businesses nationwide.”
Key findings of the survey include:
The majority of small businesses have applied for and received a PPP loan.
Over three-quarters (77%) have applied for a PPP loan and 93% of those have received the loan.
- Most small businesses interested in the loan have already applied.
Most small businesses are currently in the middle of their eight-week forgiveness window, with some nearing the end of it.
- The eight-week period ends for 7% between now and June 8, another 23% report their period ends between June 8-14, and just over one-third (36%) will move through to the end of their eight weeks the second half of June.
- The remaining 24% of borrowers are still in the early weeks of using their loan, with their eight weeks ending in July.
The vast majority of small business owners (67%) who have a PPP loan have found the loan very helpful in financially supporting their business.
- Another 14% report that the PPP loan is moderately helpful, and 11%, say it was somewhat helpful.
- Only 2% said that the PPP loan is not at all helpful and 7% said that it is too early to tell.
Borrowers are interested in the forgiveness provision and anticipate using most of their loans within their eight-week period.
- Almost one-quarter of borrowers who have received a loan have already used at least 75% of the proceeds, with 4% reporting they have used the loan entirely.
- Over one-third (34%) have used between 50-75% of the loan and another 25% have used between 25-49% of the loan to date.
To receive loan forgiveness, small businesses are required to complete an application and submit for approval. About half of the owners are using a CPA or similar professional to help fill out the application.
- About 60% of borrowers have reviewed the application and 40% have not.
- Just over half of borrowers are filling out the application themselves or are having someone on staff fill it out.
- Fifty-four percent of borrowers are using an Excel workbook to keep track of expenses, 47% are not.
About 35% of respondents applied for an EIDL loan, and the majority of them have been approved.
- Thirty-eight percent have not heard back yet and 5% were denied.
- About 36% have received the loan, up from 21% who had received the loan as of May 18.
- Sixty-nine percent of those who requested the EIDL emergency advance have received those funds.
The Main Street Lending Program is very unfamiliar to small business owners.
- Only 12% report that they are somewhat familiar with the program.
- The vast majority (88%) were not at all familiar with it.
- Just 1% of respondents anticipate applying for a loan and 21% are not sure yet.
Very few employers have had an employee take leave due to COVID-19.
- Only about 13% reported having employees take leave.
- Of those who have had an employee take leave, 30% of those employers have claimed the tax credit for reimbursement of those costs and 70% have not.
The full survey is available here.
NFIB Study: Coronavirus Impact on Small Businesses

WASHINGTON, D.C. (March 13, 2020) – The NFIB Research Center released the following data on the impact Coronavirus has had on small businesses:
The NFIB Research Center’s new survey on the current impact of the coronavirus outbreak on small businesses found that while most small businesses are not currently impacted, owners are concerned about future disruptions if the outbreak continues to escalate.
The vast majority of small businesses (74%) are not currently impacted by the coronavirus outbreak. However, the coronavirus outbreak is negatively impacting about 23% of small business owners. Three percent are positively impacted.
Of those small business owners not currently impacted, 43% anticipate their business being impacted if the coronavirus outbreak spreads to, or spreads more broadly in, their immediate area over the next three months. Twenty percent do not expect to be impacted if the outbreak spreads, and another 37% are not sure.
Of those businesses negatively impacted, 39% are experiencing supply chain disruptions, 42% slower sales, and 4% sick employees. The 4% of owners citing sick employees likely responded this way out of heightened concern and precautions with sick employees showing some signs of cold or flu-like symptoms, not necessarily because they have employees who have tested positive for the virus.
While most small business owners are not currently impacted, many are taking measurable steps to prepare their business from the coronavirus outbreak. Thirty percent of owners have stocked up on disinfectant and hand sanitizer for their business and 12% have talked with employees about sick leave or work from home policies. Three percent have modified their supply chain or changed their buyers or vendors. Just over half (52%) have not felt the immediate need to take any measurable steps. Additional comments included owners taking action by talking with employees about helpful prevention practices, such as frequent hand washing and ordering supplies and inventory ahead of schedule.
The level of concern among small business owners about the coronavirus impacting their business varies greatly in these initial weeks of the outbreak. About 44% of small business owners are “somewhat” or “very” concerned about its potential impact on their business (28% and 16% respectively). Another 37% are slightly concerned and 18%, not at all concerned.
Methodology
This survey was conducted with a random sample of NFIB’s membership database of about 300,000 small business owners. The survey was conducted by email between March 10-11, 2020. NFIB collected 300 usable responses, all small employers with 1-120 employees.